Discover how GIS technology helps track stingless bee hotspots, protect habitats, and improve pollination management for farmers and conservationists.
As global pollinator populations face unprecedented decline, stingless bees (Meliponini)—crucial native pollinators in tropical and subtropical ecosystems—are increasingly under threat due to habitat loss, climate change, pesticide exposure, and agricultural intensification. Conservation efforts and sustainable beekeeping require more than random planting or hive placement. They demand data-driven precision, and that’s where Geographic Information Systems (GIS) come in.
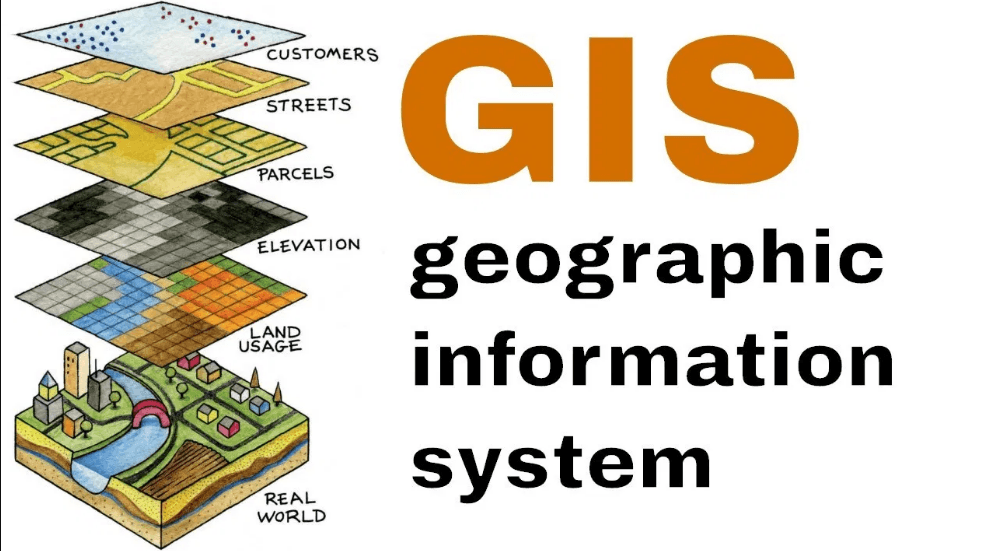
What Is GIS?
Geographic Information Systems (GIS) is a computer-based technology that collects, stores, analyzes, and visualizes geographic (spatial) data. GIS enables researchers, farmers, conservationists, and decision-makers to see patterns, trends, and relationships that are not obvious from traditional observation alone.
Key GIS functions in bee ecology:
- Mapping habitat suitability
- Predicting future bee population trends
- Analyzing land-use changes
- Optimizing hive placement
- Identifying pollinator corridors
What Are Bee Hotspots?
A bee hotspot refers to a geographical area with high biodiversity and abundance of native bees, including stingless bees. These regions often have diverse flora and suitable nesting habitats for bees to thrive. Identifying bee hotspots is crucial for prioritizing conservation efforts and implementing targeted interventions to protect these important pollinators. GIS technology plays a key role in mapping and monitoring bee hotspots, helping stakeholders make informed decisions for sustainable beekeeping practices and ecosystem preservation. By leveraging GIS data, conservationists can strategically allocate resources and develop effective strategies to safeguard stingless bee populations and their habitats.
Bee hotspots are areas of high stingless bee abundance and activity. These zones typically possess:
- Rich floral diversity and abundance
- Nesting sites like hollow trees or natural cavities
- Low pesticide and pollutant exposure
- Suitable microclimatic conditions (humidity, temperature, etc.)
- Seasonal or perennial water sources
In tropical regions, bee hotspots are often found in agroforestry systems, organic farms, forest edges, and even urban green corridors.
Why Use GIS to Track Stingless Bee Hotspots?
Traditional bee monitoring often relies on physical observation and static surveys. While valuable, they are limited in spatial scale and may miss hidden patterns across landscapes. GIS transforms this process by enabling:
- Spatial analysis of bee occurrence
- Temporal comparison of colony activity
- Visualization of habitat connectivity
- Identification of emerging threats (urbanization, deforestation)
- Integration of multiple data sources into one platform
Key GIS Layers in Bee Hotspot Analysis
| GIS Layer | Description | Purpose |
|---|---|---|
| Land Cover Maps | Forests, agriculture, urban areas | Identify habitat types |
| NDVI (Normalized Difference Vegetation Index) | Green biomass indicator | Detect floral resource zones |
| Elevation and Slope | Digital Elevation Models (DEMs) | Identify microclimates or flood risks |
| Soil Maps | pH, texture, fertility | Determine nesting potential |
| Climate Layers | Rainfall, temperature, humidity | Understand environmental suitability |
| Water Resource Maps | Streams, ponds, irrigation | Identify hydration sources |
| Pollution/Pesticide Maps | Hazardous zones | Avoid harmful areas |
| Bee Sighting Records (GPS) | Geo-tagged field data | Map hive and foraging activity |
How GIS Supports Stingless Bee Conservation and Management
1. Mapping and Visualizing Bee Distribution
GIS allows researchers to visualize where wild stingless bee colonies are found and how their densities vary across landscapes. This helps in identifying:
- Biodiversity-rich zones for conservation
- Degraded zones needing reforestation
- New areas for apiary development
2. Predictive Habitat Modeling
GIS can predict suitable habitats based on known bee preferences and environmental variables. Models like MaxEnt (Maximum Entropy) and Species Distribution Models (SDMs) use occurrence data and spatial layers to forecast:
- Areas likely to support stingless bee populations
- Future changes under climate scenarios
- Migration or foraging corridor shifts due to land-use changes
This is crucial for long-term conservation planning and climate adaptation strategies.
3. Optimizing Hive Placement for Meliponiculture
Beekeepers can use GIS to find the most productive and safest places to install hives by analyzing:
- Floral density within 300–500m radius
- Shelter from extreme heat or wind
- Access to water sources
- Minimal disturbance from roads or livestock
- Low pesticide exposure risk
4. Monitoring Forage Availability Over Time
Using satellite data and seasonal vegetation indices (like NDVI and EVI), GIS can show:
- When and where flowers bloom
- How long nectar/pollen sources last
- Periods of food scarcity that may require supplemental feeding
This is essential for hive health management, especially during droughts or agricultural off-seasons.
5. Tracking Environmental Threats
GIS can track:
- Deforestation trends
- Urban encroachment
- Agrochemical application zones
- Infrastructure development (roads, mining, etc.)
Real-World Applications and Case Studies
Brazil (Atlantic Forest)
Researchers used GIS to identify forest fragments with high stingless bee diversity and connected these with protected pollination corridors for organic fruit farming.
Kenya (Mount Elgon Forest Reserve)
GIS and local GPS records mapped the distribution of Meliponula ferruginea colonies. The data helped NGOs introduce hive boxes in safe, high-forage buffer zones between forests and farms.
Australia (Queensland)
Spatial analysis of Tetragonula carbonaria colonies helped design urban pollinator parks using native plants and cavity-providing trees.
Recommended GIS Tools for Bee Hotspot Mapping
| Tool | Description |
|---|---|
| QGIS | Free, open-source desktop GIS for spatial analysis and map creation |
| ArcGIS Pro | Advanced commercial GIS with machine learning tools |
| Google Earth Engine (GEE) | Cloud-based tool for analyzing satellite imagery and environmental data |
| iNaturalist / Bee Tracker | Mobile platforms for field-based bee sightings |
| MapBiomas | Land-use change platform with high-resolution Brazilian data |
| Global Forest Watch | Monitors deforestation in near-real-time |
How You Can Get Involved
For Farmers & Beekeepers:
- Learn basic QGIS to analyze your land
- Map floral resources and avoid spraying during peak bloom
- Share sightings using mobile apps to improve regional databases
For Researchers:
- Build predictive models for different stingless bee species
- Partner with community groups for long-term data collection
- Integrate drone and LiDAR data for 3D habitat modeling
For NGOs & Policymakers:
- Use GIS maps to define conservation priority zones
- Monitor policy impacts on pollinator habitats
- Design agroecological corridors that connect fragmented bee habitats
Benefits of GIS in Bee Hotspot Mapping
- Enables targeted conservation of threatened bee populations
- Boosts honey yields through smart hive placement
- Enhances scientific understanding of bee-environment interactions
- Supports climate-resilient agricultural planning
- Promotes participatory mapping through citizen science
FAQs
- What is GIS in simple terms?
GIS is a technology that uses maps and data analysis to understand spatial patterns and relationships. - How does GIS help stingless bees?
It tracks bee hotspots, foraging zones, and habitat quality to support conservation and pollination. - What are bee hotspots?
Areas with high bee activity, rich in nectar and pollen sources. - Can farmers use GIS for better pollination?
Yes, GIS helps farmers know where to place hives for maximum crop pollination. - How does GIS show habitat quality?
By combining data on vegetation, land use, and pesticide exposure. - Can GIS predict climate impacts on bees?
Yes, it models how temperature and rainfall shifts affect bee habitats. - Do stingless bees have smaller foraging ranges than honeybees?
Yes, typically within a few hundred meters, making local mapping crucial. - What role does GIS play in urban beekeeping?
It helps design parks and green corridors that sustain bees in cities. - Is GIS data expensive to obtain?
High-quality datasets may be costly, but many open-source options exist. - Can GIS be combined with drones?
Yes, drones provide detailed images that enhance GIS mapping. - What are the main challenges of using GIS in bee research?
Data scarcity, technical skill requirements, and rapid habitat changes. - Can GIS help in protecting endangered stingless bees?
Yes, by identifying critical habitats for conservation efforts. - How do NGOs use GIS for bees?
They map hotspots and prioritize restoration projects. - Can GIS track pesticide effects on bees?
Yes, by overlaying pesticide application data with bee activity maps. - Does GIS improve honey production?
Indirectly, yes — by ensuring bees have better forage and healthier environments. - How often should GIS bee maps be updated?
Regularly, especially in areas facing rapid land-use or climate change. - What skills are needed to use GIS for bees?
Mapping, data analysis, and knowledge of pollinator ecology. - Are there open-source GIS tools available?
Yes, tools like QGIS offer free and powerful mapping capabilities. - How does GIS benefit biodiversity?
It tracks multiple species and ensures habitat protection strategies. - What is the future of GIS in pollinator management?
AI-powered predictive models and real-time monitoring of bee activity.
Final Thoughts
The use of Geographic Information Systems (GIS) in tracking bee hotspots marks a revolutionary step in stingless bee research, meliponiculture, and environmental conservation. With the help of spatial data, we can better understand bee ecology, optimize pollination services, and combat habitat loss—paving the way for a more resilient and pollinator-friendly planet.